Tracking incident and injury trends is a helpful way to shore up your organization’s safety program. However, it can also be helpful to track your workplace data against injury data for your industry and private employers nationally.
Looking at workplace injury statistics can help point out common pain points and even start to spur solutions. And solutions are needed: 2019 marked the third straight year that the total recordable incident rate remained a 2.8. In other words, workplaces are holding on to safety improvements, but they’re struggling to reduce their injuries further.
In this article, we review the latest workplace injury statistics as published and updated by the CDC, OSHA, and BLS.
- Total Rate of Workplace Fatalities in 2019: 5,333 in 2019, or 3.5 fatalities per 100,000 full-time workers — up 2 percent from 2018
- Total Rate of Injuries and Illnesses in 2019: 2.8 per 100 full-time workers — unchanged from 2018
Most Dangerous Jobs: Workplace Fatalities by Occupation
Let’s begin with the worst-case scenario: workplace fatalities.
Workplace fatalities reached the highest level in In 12 years with 5,333 fatalities in 2019. The 2019 number represented a 1.65% increase from 2018, when 5,657 were recorded in 2007.
The recent data from the Census of Fatal Occupational Injuries revealed that:
- Every 99 minutes, a worker died from a work-related injury in 2019.
- Fatalities increased among workers age 55 and older by 8 percent from 1,863 in 2018 to 2,005 in 2019 – the largest ever recorded for this age group.
- Workplace deaths due to suicides (307 recorded) and unintentional overdoses (313 registered) increased slightly in 2019.
Behind the Numbers: Workplace Death Statistics
It is disheartening to continue seeing a higher number of worker fatalities even at the many safety advancements increasingly available to employers nationwide. Although the rate of fatalities didn’t change between 2018 and 2019, the number grew. And every fatality is both preventable and devastating.
There are industries where deaths remain stubbornly high.
For instance, workers in extraction occupations and construction experienced 1,066 fatal injuries – the highest total since 2007, which is a 6.3% increase from 2019. Roofers in private industry have an incredibly highfatality rate of 54 per 100,000 workers.
Moreover, drivers/sales workers, including truck drivers, experienced 1,005 fatal injuries, which is the most since 2003.
On a final note: deaths due to unintentional doses from non-medical drug or alcohol use increased slightly to 313 — the seventh straight annual increase in this category.
The Most Common Causes of Workplace Fatalities
Before diving into the most common cause of fatalities, let’s firstly assess the most affected employees that suffer workplace fatality
- Nursing assistants – 370 incidents per 10,000 Full-time workers
- Heavy truck and tractor-trailer truck drivers – 360 incidents per 10,000 Full-time workers
- Laborers and freight, stock, and material movers – 350 incidents per 10,000 Full-time workers
- Light truck drivers – 340 incidents per 10,000 Full-time workers
- Construction laborers – 250 incidents per 10,000 Full-time workers
- Maintenance and repair workers – 210 incidents per 10,000 Full-time workers
- Stockers and order fillers – 150 incidents per 10,000 Full-time workers
- Janitors and cleaners – 120 incidents per 10,000 Full-time workers
- Registered nurses – 105 incidents per 10,000 Full-time workers
- Retail salespersons – 60 incidents per 10,000 Full-time workers
Although health and safety in the workplace have been a priority over the years, there are definitely areas that require urgent attention. The U.S. Bureau of Labor 2019 Statistics data revealed the following as the most recent causes of fatalities for individual workers.
- Violence and other injuries caused by animals or persons – 8 incidents per 10,000 full-time workers
- Contact with equipment or objects – 24 incidents per 10,000 full-time workers
- Transportation accidents – 7 incidents per 10,000 full-time workers
- Overexertion and bodily reaction – 33 incidents per 10,000 full-time workers
- Slips fall, and trips – 27 incidents per 10,000 full-time workers
Despite the increasing causes of injury and workplace accidents, there is a persistent four popularly called the fatal four according to BLS and OSHA. These four are the most common causes of construction site death. They are:
- Falls – 33.5% of construction worker deaths
- Struck by an object – 11.1% of construction worker deaths
- Electrocutions – 8.5% of construction worker deaths
- Caught in/between – 5.5% of construction worker deaths
What’s more? These four hazards represent 60 percent of the deaths of construction workers. Construction experiences the most fatal falls of all industries, raising the sector to 51 percent top of falls in the U.S.
In addition:
- Carrying heavy objects and lifting with tools are the leading causes of injury.
- Self-employed workers and companies with fewer staff members account for nearly half of all deaths on construction sites.
These injury rates are already heartbreaking. However, it’s also worther remembering that about half of severe workplace injuries go unreported each year, indicating that the rate of accident is much higher than even these numbers show.
What Industries Have the Highest Injury Rates?
Reading the 2019 Employer-Reported Workplace Injuries and Illnesses by the BLS can be regarded as a good read. Although there were still cases recorded, it remained the same as that of 2018. In 2019, 888,200 cases were recorded as non-fatal injuries and illnesses.
Discussion regarding industries with the highest injury rate needs adequate concern.
- Construction: 1061 number of fatal work injuries – 9.7%
- Transportation and warehousing: 913 number of fatal work injuries 13.9%
- Agriculture, Fishing, and Hunting: 573 number of fatal work injuries – 23.1%
- Government: 426 number of fatal work injuries – 1.8%
- Retail trade: 291 number of fatal work injuries – 2%
- Leisure and Hospitality: 271 number of fatal work injuries – 2.2%
- Other services (excl. Public admin): 210 number of fatal work injuries – 3%
- Educational and Health Services: 197 number of fatal work injuries – 0.8%
- Wholesale trade: 178 number of fatal work injuries – 4.9%
- Mining, quarrying, and oil and gas extraction: 127 number of fatal work injuries – 14.6%
Besides, the manufacturing industry accounted for 15% of all 2019 private industry nonfatal injuries and illnesses. Moreover, it was the only private industry sector to have a statistical change in its TRC rate over the year. It decreased from 3.4 in 2018 to 3.3 per 100 full-time workers in 2019.
2020 Most-Common Safety Violations Cited by OSHA
Being on the top of a list is usually considered a good thing, unless the list is of most common safety violations. Even though the list of most common OSHA violations remains largely unchanged since 2017, the question remains: why?
The top ten most common OSHA violations in 2020 were:
- Fall Protection – General Requirements: 5,424 violations
- Hazard Communication: 3,199 violations
- Respiratory Protection: 2,649 violations
- Scaffolding: 2,538 violations
- Ladders: 2,129 violations
- Lockout/Tagout: 2,065 violations
- Powered Industrial Trucks: 1,932 violations
- Fall Protection – Training Requirements: 1,621 violations
- Personal Protective and Life Saving Equipment – Eye and Face Protection: 1,369 violations
- Machine Guarding: 1,313 violations
Patrick Kapust, the deputy director of OSHA’s Directorate of Enforcement Programs words, “These are common violations that we are finding and have been in place for numbers of years.” He added, “The answers are out there, employers shouldn’t feel like it is a complex issue. If you don’t know the answer, endeavor to contact OSHA.”
The 10 most frequently standards remained unchanged from 2019, they only swapped positions. Fall protection bagged its 10th year running as the most commonly cited standard. Ladders rose to a top-five spot from the sixth position in 2019, while Respiratory Protection jumped to third place from fifth place in 2019.
As Kapust recommended, “Use the top 10 as a guide for your workplace. It is a good starting point, and if you don’t know how to start, look at what OSHA is finding and how they apply to your industry as well”.
Looking for more insight? Grab Safesite’s key takeaways from back when OSHA first announced its top ten list for 2020.
Key Takeaways from 2021 Workplace Injury Statistics
Statistics are numbers, but they offer much more than a look at how many people got injured or where. They invite us to look at trends and take a deeper look at their own risk management in a strategic attempt to prevent future incidents.
So what can we learn from the 2021 statistics?
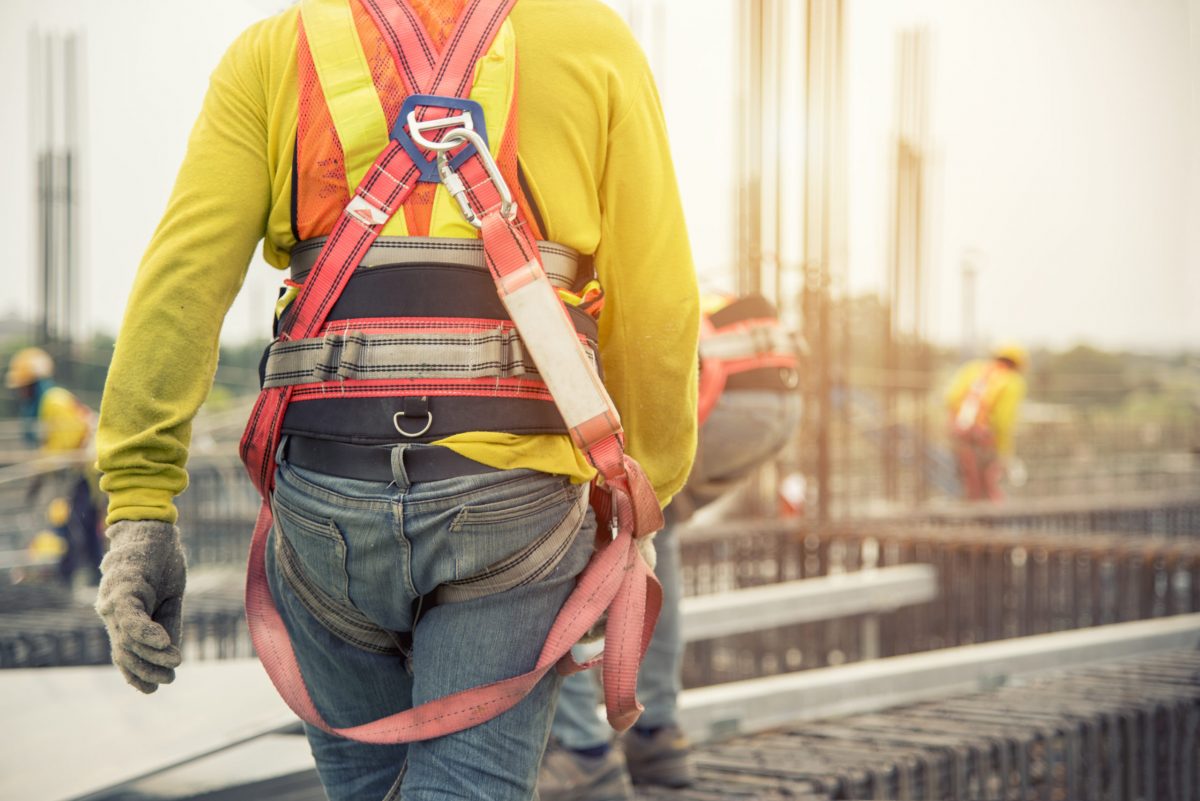
- Roofers have an incredibly high fatality rate, and OSHA’s fall protection standards make the list of most commonly cited standards twice. Now is a great time to double-check your fall protection program: do you have the equipment needed and does it fit every team member? does everyone have the training needed to identify risks and work safely at heights?
- Carrying heavy objects is an incredibly common way to get injured. If your TRIR and LTRIR have plateaued, consider manual handling training for workers. Ergonomic injuries can seem small and go unreported, but one wrong move can turn pain point into a full-blown recordable and compensable injury.
- Injuries and fatalities related to driving on are on the rise. Everyone has a role to play in keeping roads and worksites safe. Consider running safe driving toolbox talks to reiterate driving skills and remind workers of your policies on distracted driving.
Managing the many sides of safety can be tough. Safesite can help you organize and deploy your safety program. Check out the list of safety actions you can complete in under two minutes with the Safesite app.